Native Frame Analytics
Native Frame Analytics is a powerful suite of tools designed to give you complete visibility into your live streaming performance. By combining real-time monitoring with historical trend analysis, Native Frame Analytics empowers you to optimize your streams, troubleshoot issues quickly, and make data-driven decisions to grow your audience.
Our analytics platform is divided into two main components:
- Monitor: Provides real-time metrics for your active streams, allowing you to track performance as it happens and respond immediately to any issues.
- Trends: Delivers historical data and performance metrics for up to the last 30 days, enabling you to analyze long-term patterns, identify peak times, and track the growth of your streaming platform over time.
Whether you're managing a single high-stakes event or overseeing a platform with thousands of concurrent streams, Native Frame Analytics gives you the insights you need to ensure top-quality broadcasts and maximize viewer engagement. From bitrate fluctuations to viewer counts, from real-time troubleshooting to long-term strategic planning, our comprehensive analytics suite is your central hub for streaming success.
In the following sections, we'll dive deep into how to use both the Monitor and Trends features to their full potential, helping you harness the power of data to elevate your streaming experience.
Remember that each project you create in Native Frame has its own set of streams and associated analytics. This project-based organization allows you to manage and analyze multiple streaming initiatives separately.
To view analytics for your streams:
- Log in to your Native Frame dashboard
- Select the project you want to analyze from your project list
- Click on "Analytics" in the main navigation menu
Monitor
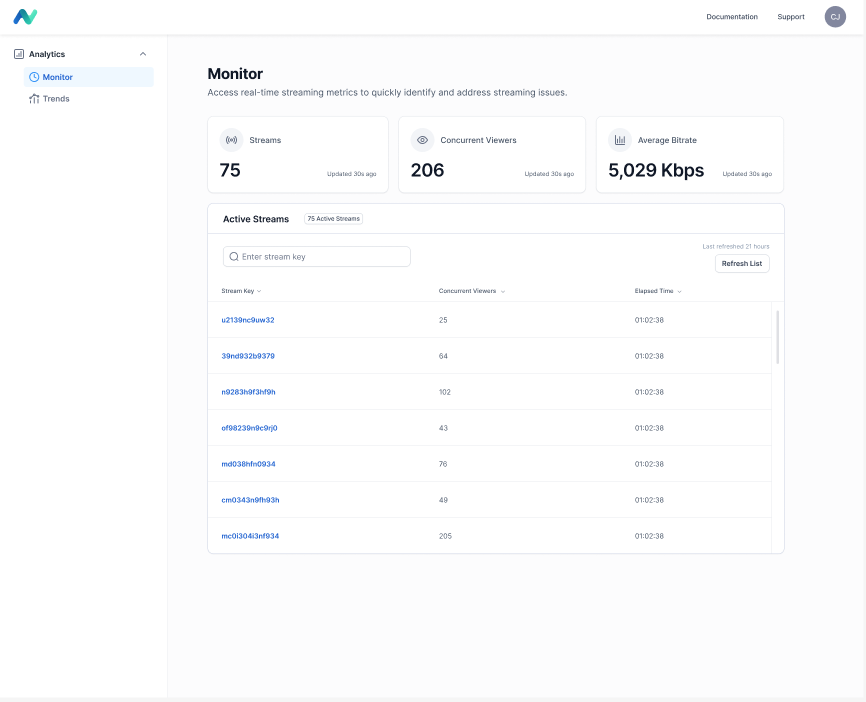
The Monitor section of Native Frame Analytics provides real-time streaming metrics, allowing you to quickly identify and address any streaming issues as they occur. This feature offers both aggregate data across all active streams and detailed information for individual streams.

Understanding the Monitor Dashboard
The Monitor dashboard presents a real-time overview of your active streaming metrics:
Key Aggregate Metrics
- Streams: The total number of streams currently active on your platform
- Concurrent Viewers: The total number of viewers currently watching across all active streams
- Average Bitrate: The mean data transfer rate across all active streams, measured in Kbps (Kilobits per second). A higher bitrate generally indicates better video quality but requires more bandwidth.
Each of these metrics displays when it was last updated, ensuring you have the most current information.
Active Streams Table
This table provides detailed information for each individual active stream:
- Stream Key: A unique identifier for each stream. Clicking on a stream key will open up detailed stream data
- Concurrent Viewers: The current number of viewers watching this specific stream
- Elapsed Time: The duration the stream has been active
Using the Monitor Dashboard
- Real-time Overview: The top section provides an at-a-glance view of your overall streaming activity
- Stream Search: Use the "Enter stream key" search box to quickly find a specific stream in the Active Streams table
- Detailed Stream Information: The Active Streams table allows you to monitor individual stream performance
- Refresh Data: Click the "Refresh List" button in the top right of the Active Streams table to manually update the stream information
Monitoring Individual Stream Performance

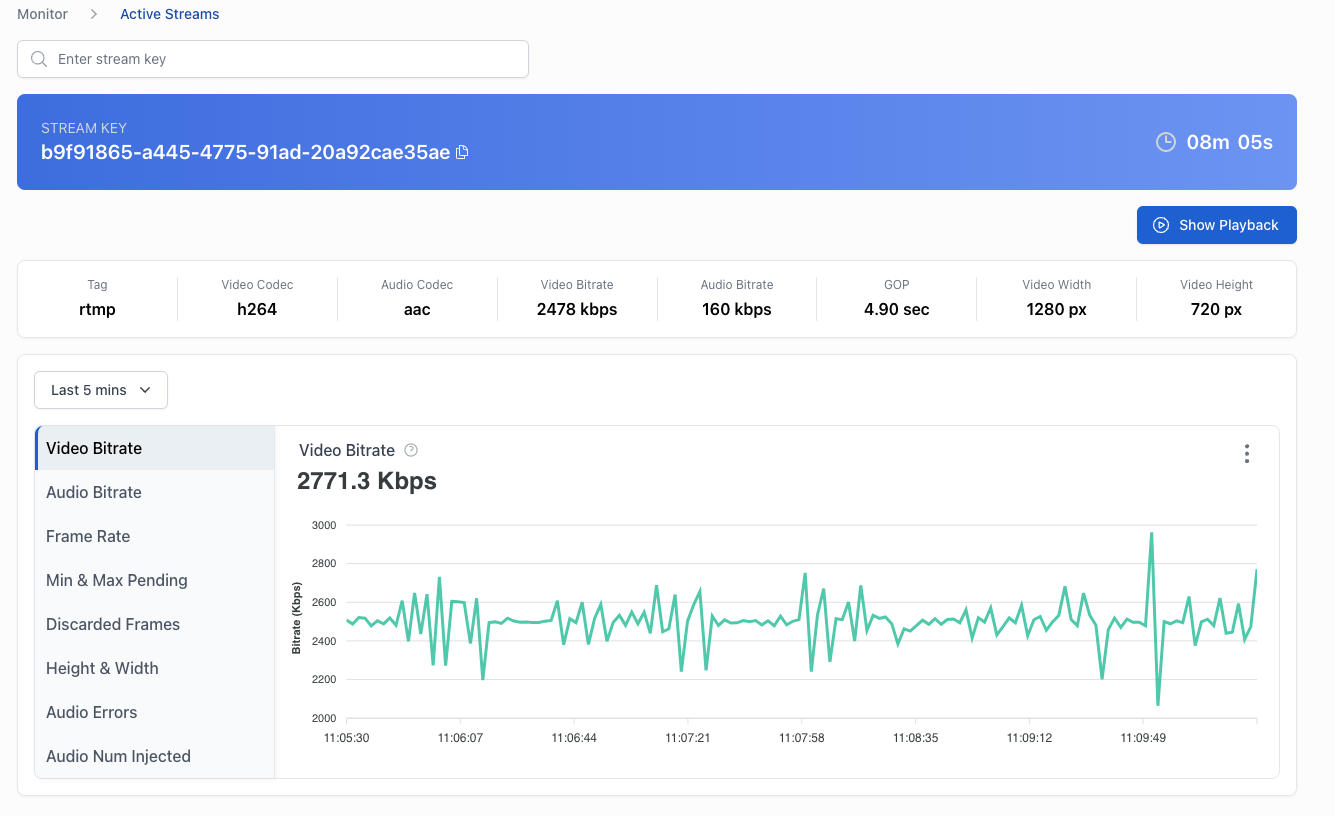
The individual stream view in Native Frame Analytics provides detailed, real-time information about a specific active stream. This powerful tool allows you to monitor and troubleshoot individual broadcasts with precision. You can identify the stream by looking at header information:
- Stream Key: The unique identifier for the stream (e.g., 39nd932b9379)
- Stream Duration: The total time the stream has been active (e.g., 1d 20h 04m 41s)
You can also see stream metadata:
- User Name: The username of the broadcaster
Remember that since you are interacting with a third party platform, choose User Names that do not leak Personally Identifiable Information.
Real-time Metrics Graph
A line graph displaying various metrics over time. Users can select different metrics to view:
- Video Bitrate: the current video data rate (e.g., 7740 kbps)
- Audio Bitrate: the current audio data rate (e.g., 128 kbps)
- Frame Rate: frames per second of the video (e.g., 7.00 fps)
- Min & Max Pending: minimum and maximum number of events or data points that are waiting to be processed at any given time during the monitoring period
- Discarded Frames: video frames that are dropped or not processed during the streaming process
- Height & Width: the vertical and horizontal resolution of the video
- Audio Errors: issues that can affect the quality, consistency, or presence of audio in a live broadcast
- Audio Num Injected: how many audio frames need to be injected. If there is a gap in the audio data, the transcode service will fill in those gaps with empty/silent audio data.
The graph can be adjusted to show data for different time ranges (e.g., Last 5 mins).
Additional Features
- Start Playback: Button to begin playback of the stream for monitoring purposes.
Trends
The Trends section of Native Frame Analytics provides valuable insights into your streaming performance over time. Trends allows you to analyze historical data for up to the last 30 days, either as an aggregate across all streams or for individual streams.

Understanding the Trends Overview
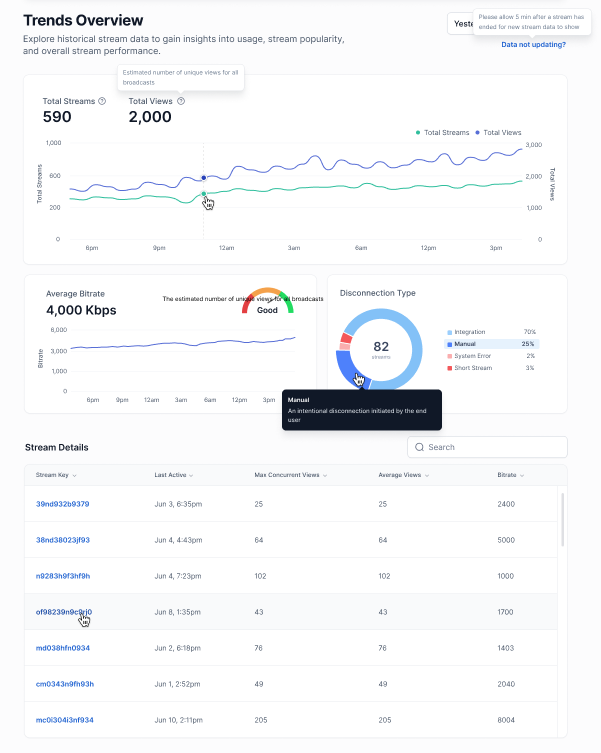
The Trends Overview presents a comprehensive view of your streaming metrics:
Key Metrics
- Max Total Streams: The highest number of broadcasts started in an interval during the selected time period
- Average bitrate: Average bitrate across all streams in Kbps (Kilobits per second). A higher bitrate generally indicates better video quality
Time Series Graph
The main graph displays Total Streams over time. Hover over any point on the graph to see specific data for that time
- Green line: Represents Total Streams
Disconnection Type
A pie chart displays the distribution of stream end reasons per hour:
- Normal Disconnection: An intentional disconnection
- System Error: A disconnection caused by a technical failure or malfunction in the streaming system
- Short Stream: An unintentional disconnection likely due to poor network conditions or other anomalous behavior, resulting in a stream that ends prematurely
Stream Details Table
The streams details table provides specific information for individual streams:
- Stream Key: Unique identifier for each stream
- Last Active: Date and time the stream was last live
- Max Concurrent Views: Highest number of simultaneous views
- Average Views: Mean number of views throughout the stream
- Bitrate: Average bitrate for the stream in Kbps
Best Practices for Using Trends
- Identify Peak Times: Use the time series graph to determine when your streams attract the most viewers.
- Assess Stream Health: Monitor the Average Bitrate to ensure consistent stream quality.
- Analyze Disconnections: Use the Disconnection Type chart to identify any recurring issues causing unexpected stream terminations.
- Evaluate Individual Performance: Utilize the Stream Details table to compare metrics across different streams and identify top performers.
- Track Growth: Compare Total Streams and Total Views over time to measure your platform's growth and engagement.